Descriptive Statistics on StatKey
ACTIVITY
Create a graphical display of quantitative data using StatKeynew window.
On StatKeynew window, select One Quantitative Variable from the main page.
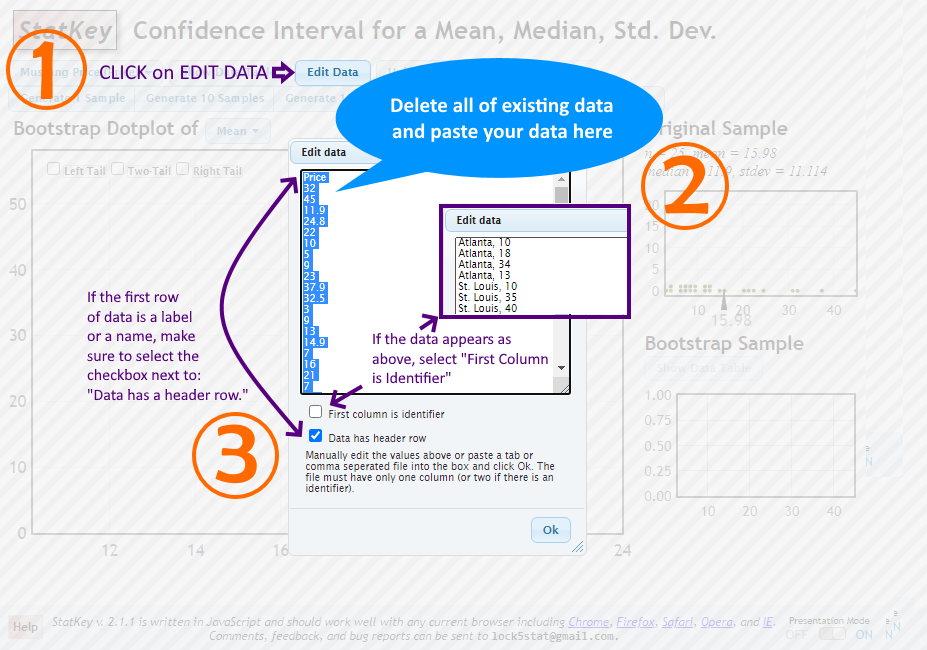
STEP 1: Click on Edit Data button to enter your data.
STEP 2: Delete existing data before pasting or entering your data. Make sure to enter only one data value per line.
Don't have data? Copy the YouTube Videos data from this sample datanew window page onto your clipboard and paste it into the Edit Data entry box.
STEP 3: If your data has an identifier column used as labels, check the option for First column is identifier, otherwise leave it unchecked. Also, if the first row (header) of the data set you entered is a label/variable name, check the option for Data has a header row.
Note: If your data set starts with your data values, do not forget to uncheck the Data has a header row option. Otherwise, StatKey will discard the first data entry.

After your data entry, click the Ok button.
Select the Histogram tab at the top of the StatKey display to render a histogram of your data.
You can change the number of bars that appear by using the Number of buckets slider in the Histogram Controls section on the right.
You can change the minimum and maximum for the buckets as well as the number of buckets using the Set Limits button.
StatKey shows the Summary Statistics of the data on the right sidebar. Information shown includes:
Sample size: The number of entries in the data set, n
Mean: Sample mean (average), x̄
Standard Deviation: Sample Standard Deviation, s
Also displayed is the five-number-summary of data:
Minimum
Q1
Median
Q3
Maximum
Note: The five-number-summary on StatKey can be different from that of the results on other online calculators as SubediCalc, LibreText, and Desmos. Please consult with your instructor for further clarifications.